

Full-Stack Observability
for Hybrid Cloud Environment
From Network to System and User Experience
Real-Time, Bird's-Eye View of Entire IT Infrastructure


The Culmination of EXEM’s Expertise
on a Single Platform
ONE Platform Solution
Manage all IT infrastructure and business KPIs across cloud and on-premise environments.
Flexible Data Visualization
Efficiently manage data in large‑scale infrastructure environments with customizable dashboards.
Precise Root Cause Diagnosis
Identify core issues by analyzing correlations with our powerful query engine.
Real-Time Monitoring and Alerts
Detect anomalies early with real‑time collection and analysis of logs, metrics, and transaction data.
AI-driven Data Insights
Simplify IT management with machine learning that automatically detects and alerts on anomalies.
Monitoring that Drives Performance
Connect key metrics across the system with business KPIs to drive service-level performance gains.
AI Infrastructure GPU Monitoring
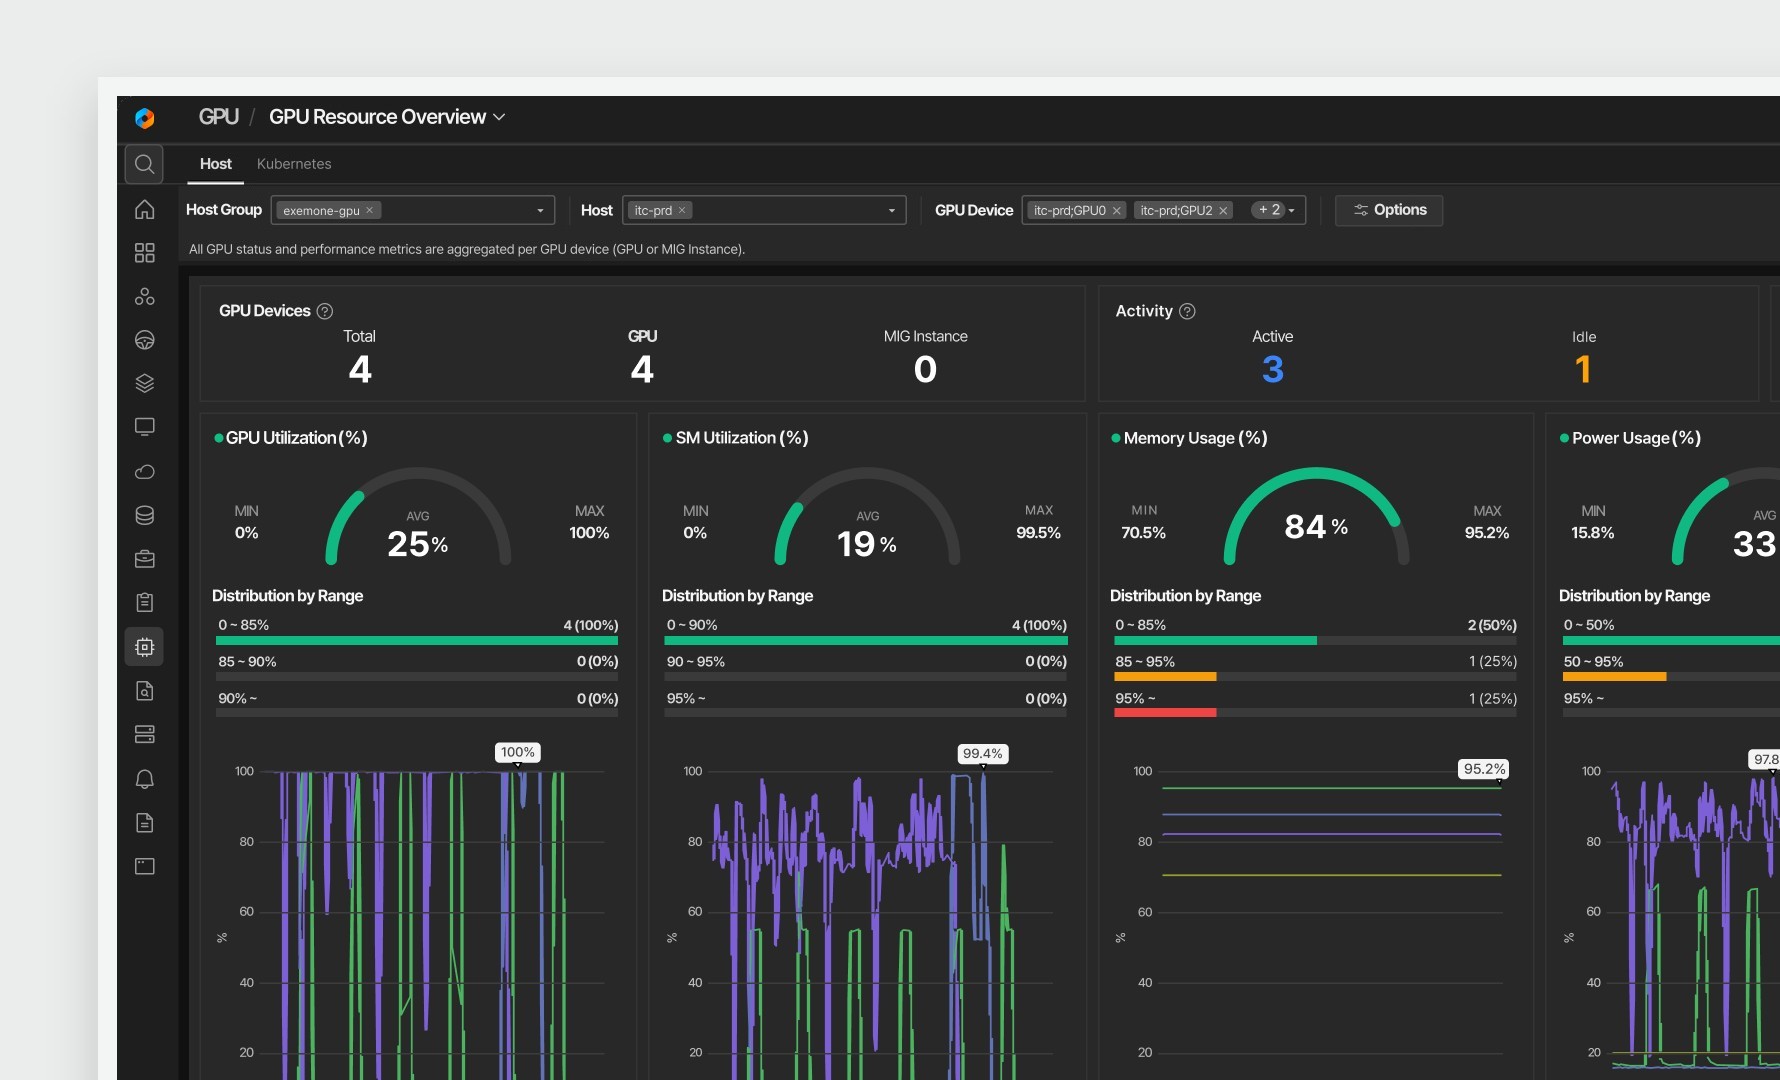
See scattered GPU information on one screen, from GPU devices and MIG instances to the Pods using them.
Full-Stack Observability
Connecting Every Layer of IT
with Full-Stack ObservabilityexemONE collects and manages data across your entire IT environment in real time to accurately gauge system health and performance.
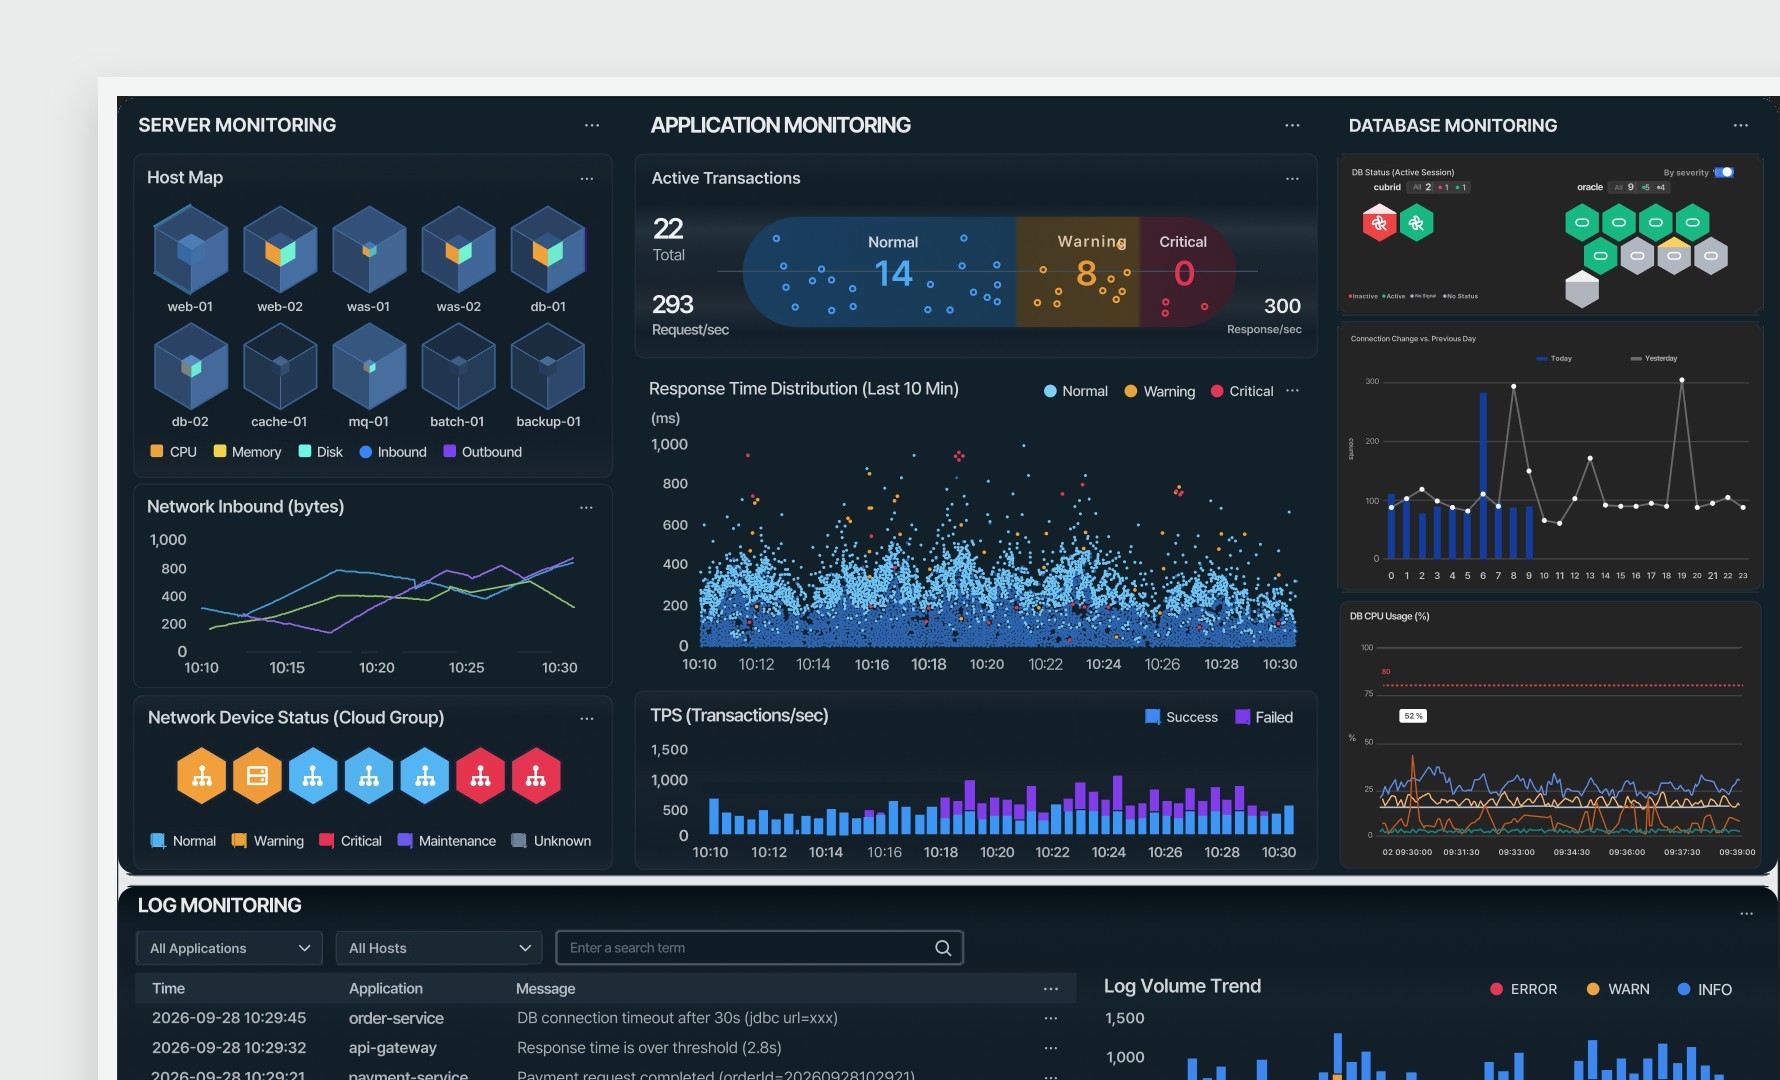
Purpose-Driven Dashboards
The Right Data
for Every PurposePast and Present
at a GlanceOrganize the metrics you need by operational purpose and user perspective. Check key status and performance on a single dashboard to grasp operations quickly.
Retrieve data from any point in time and visualize it in multiple ways with inter‑widget linking, while tracking performance and trends simultaneously.
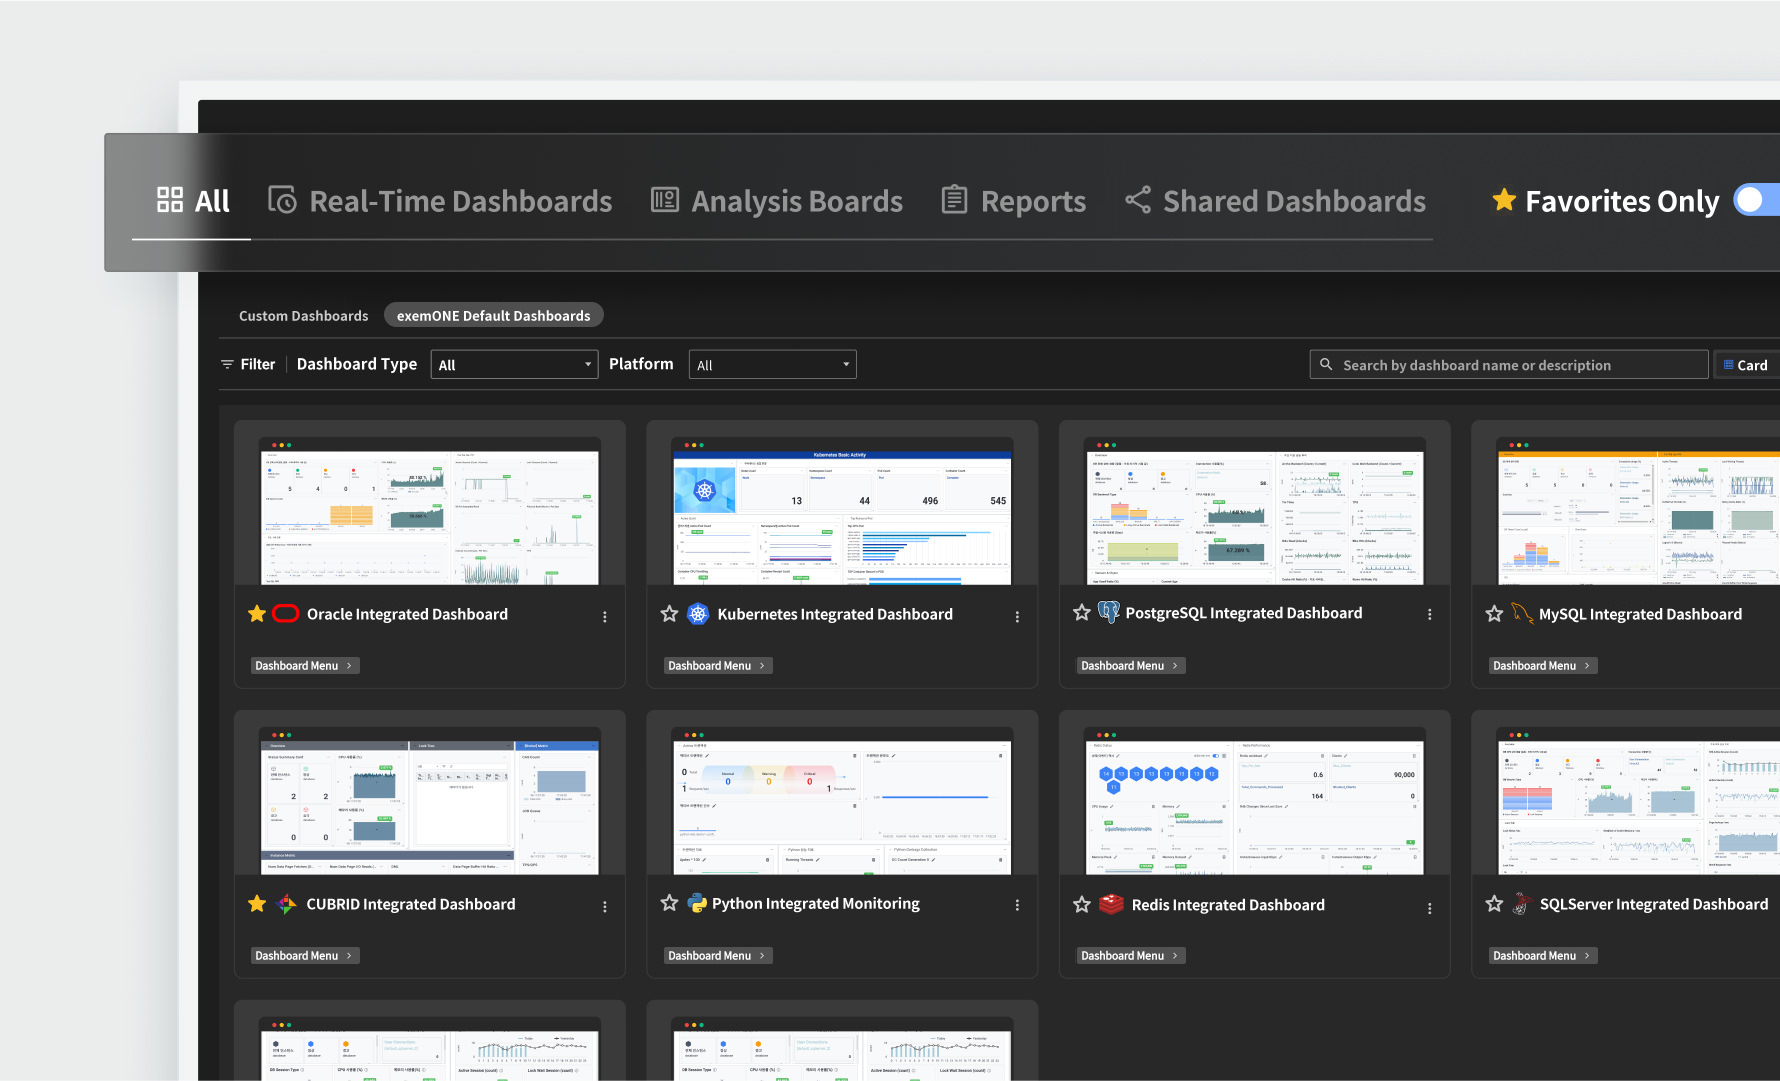
Customization
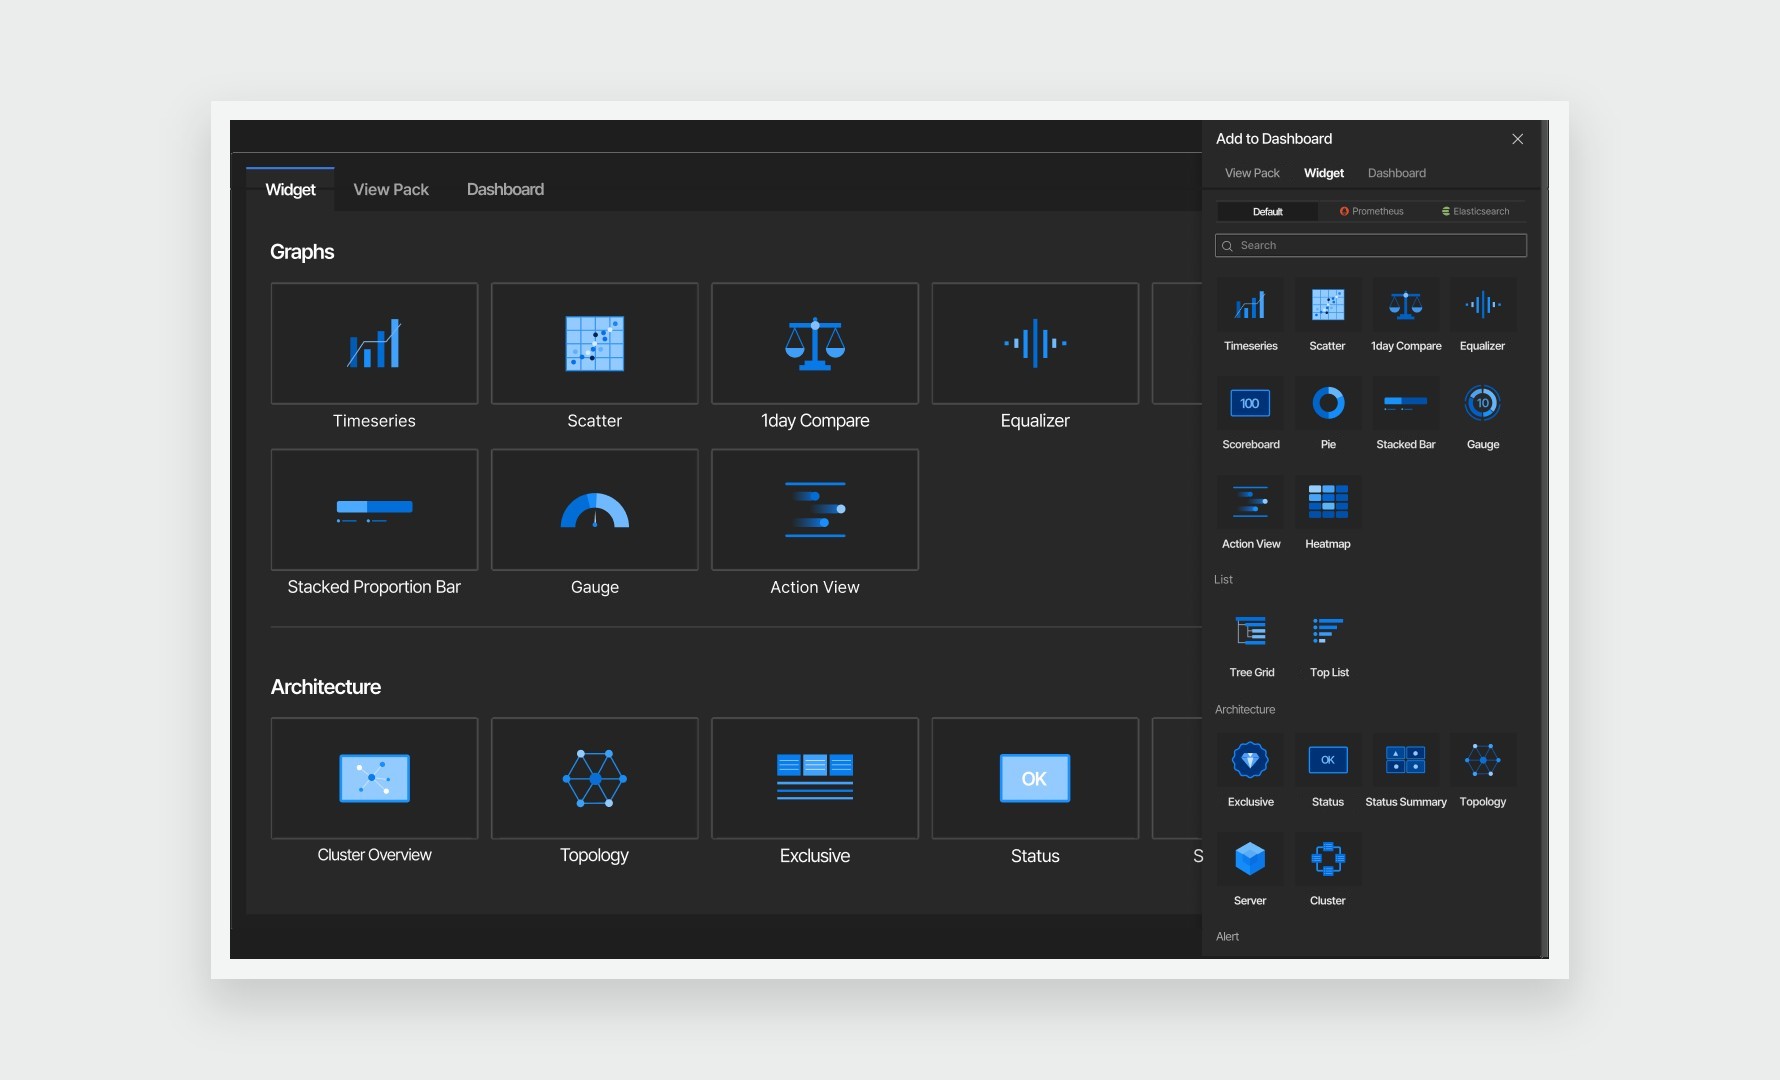
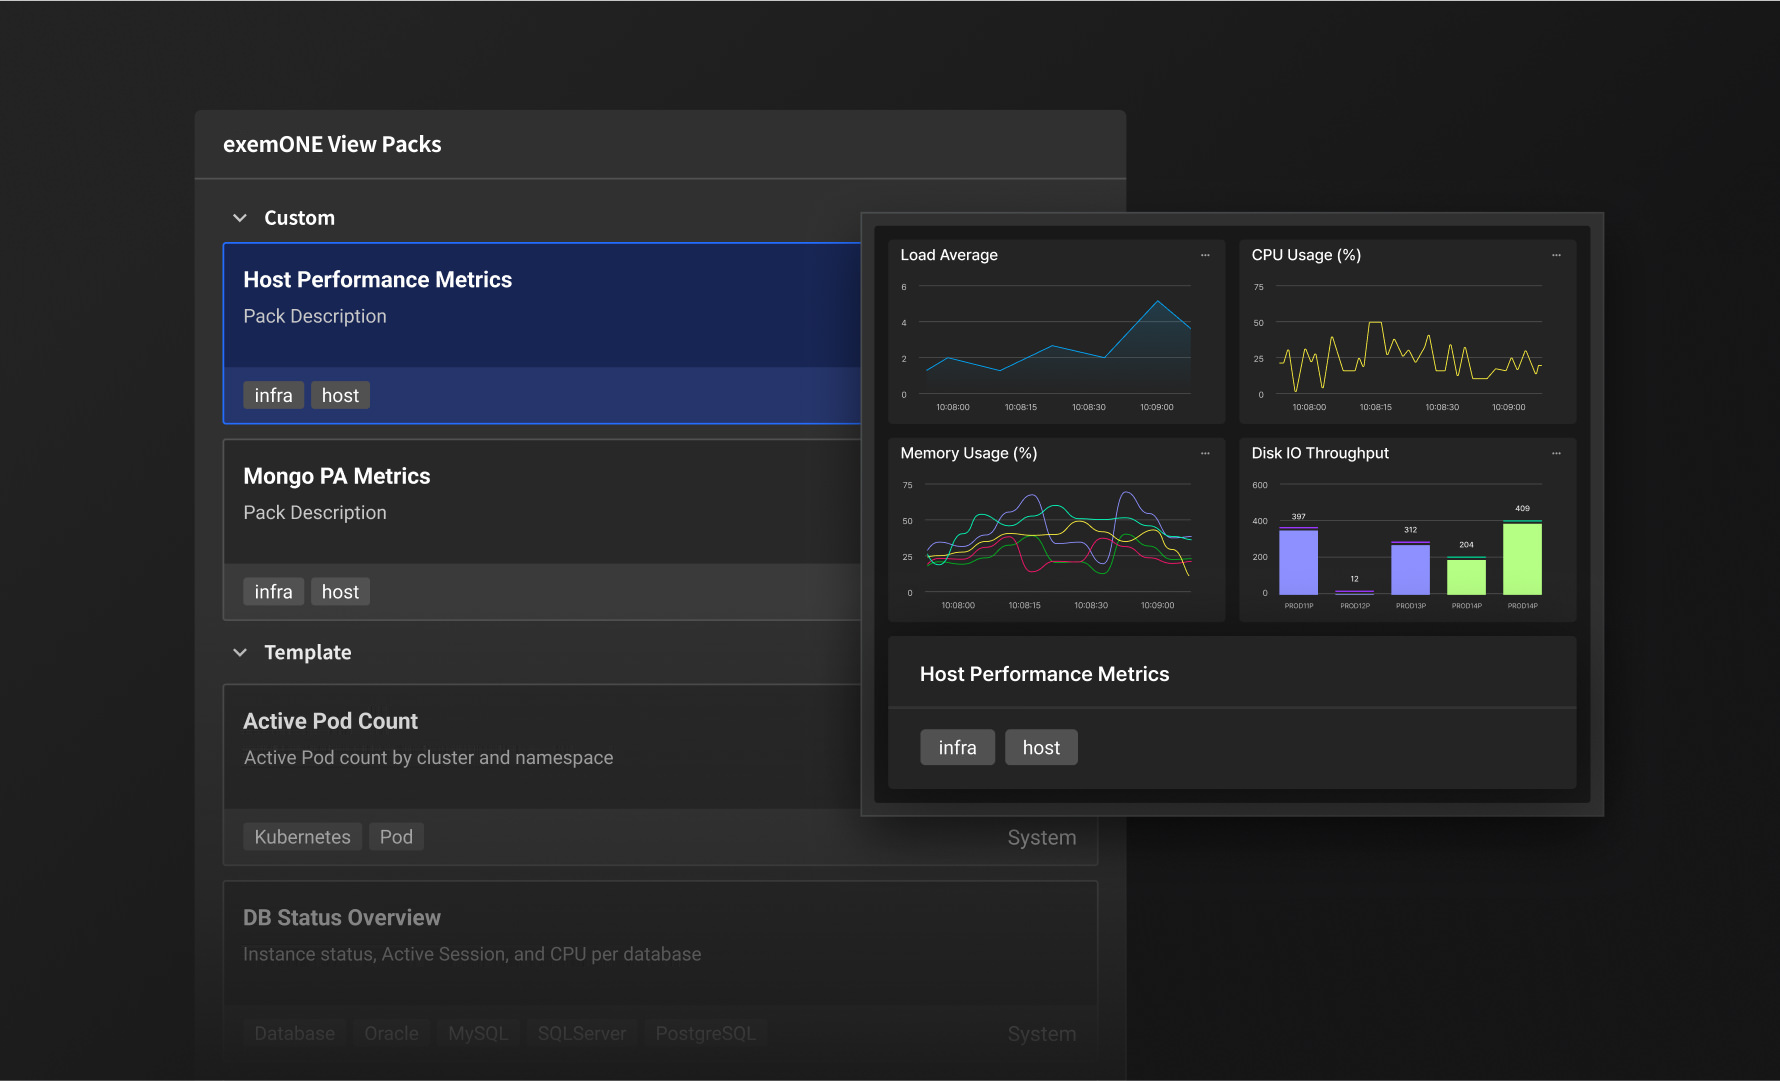
Build Your Own
Customized DashboardSet up Dashboard
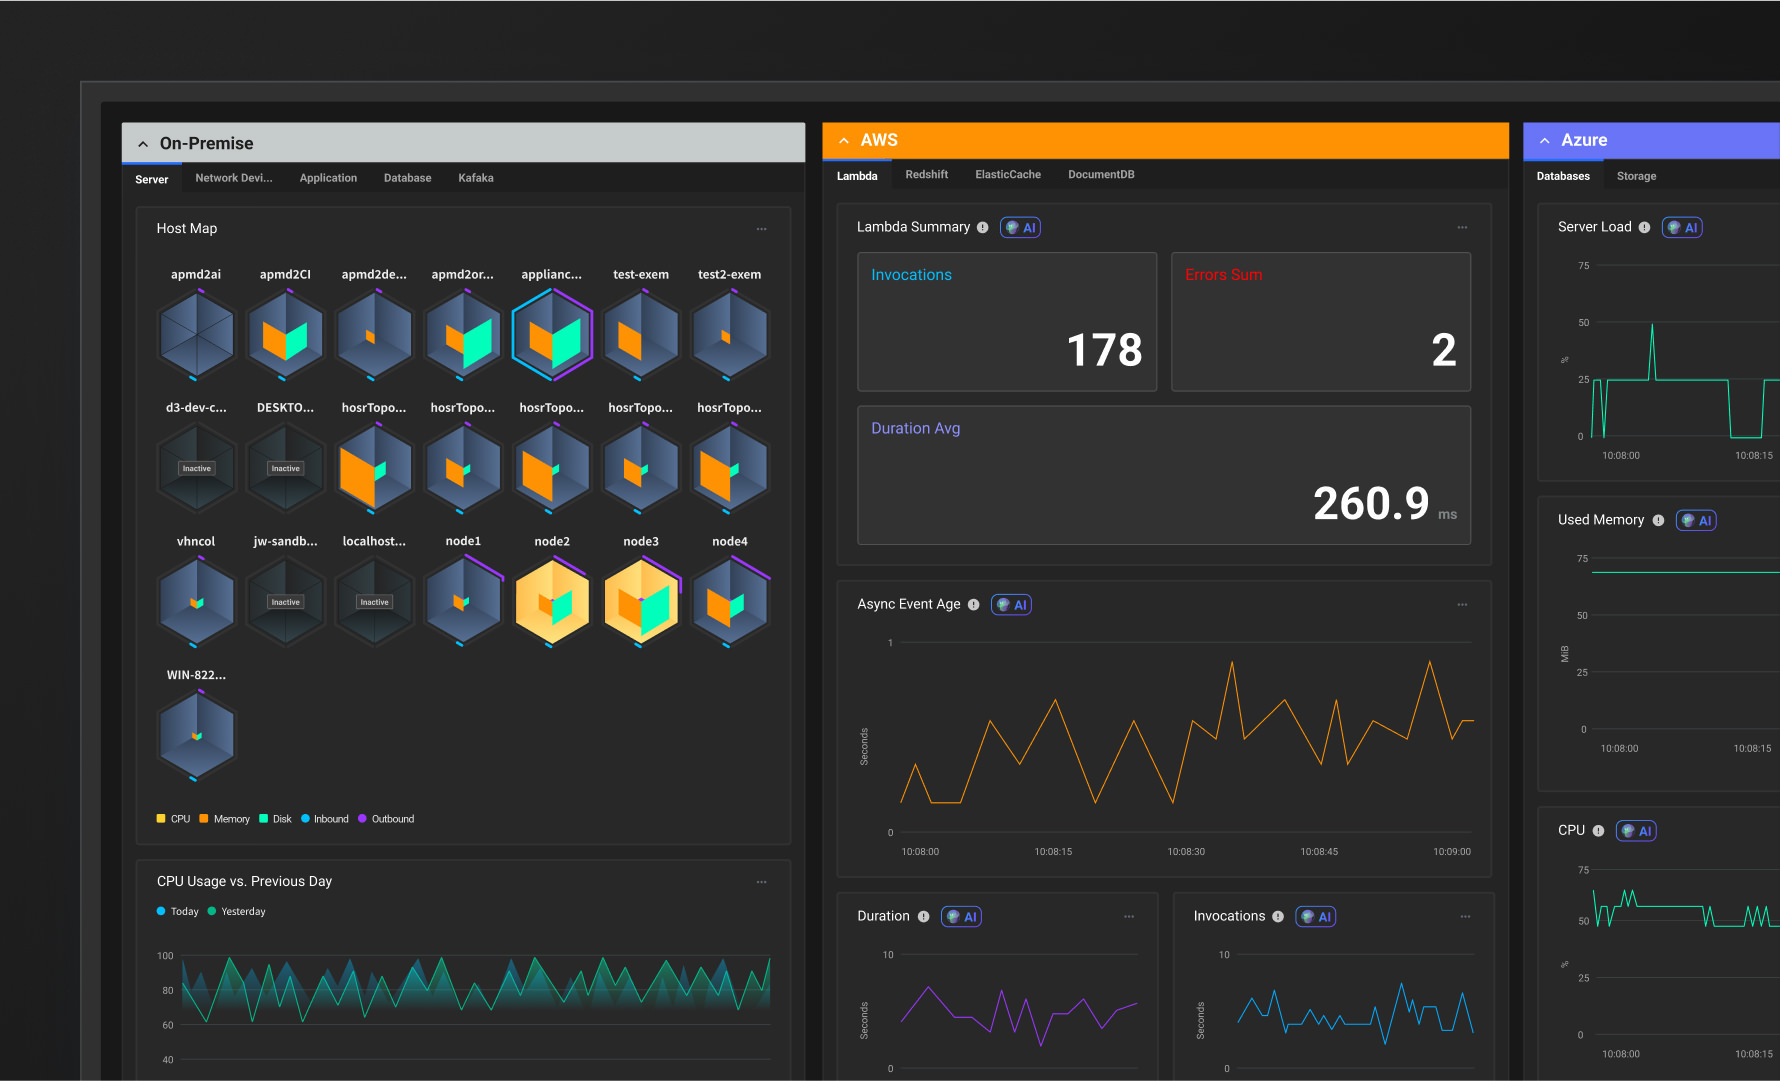
with a Single ClickBeyond Boundaries of
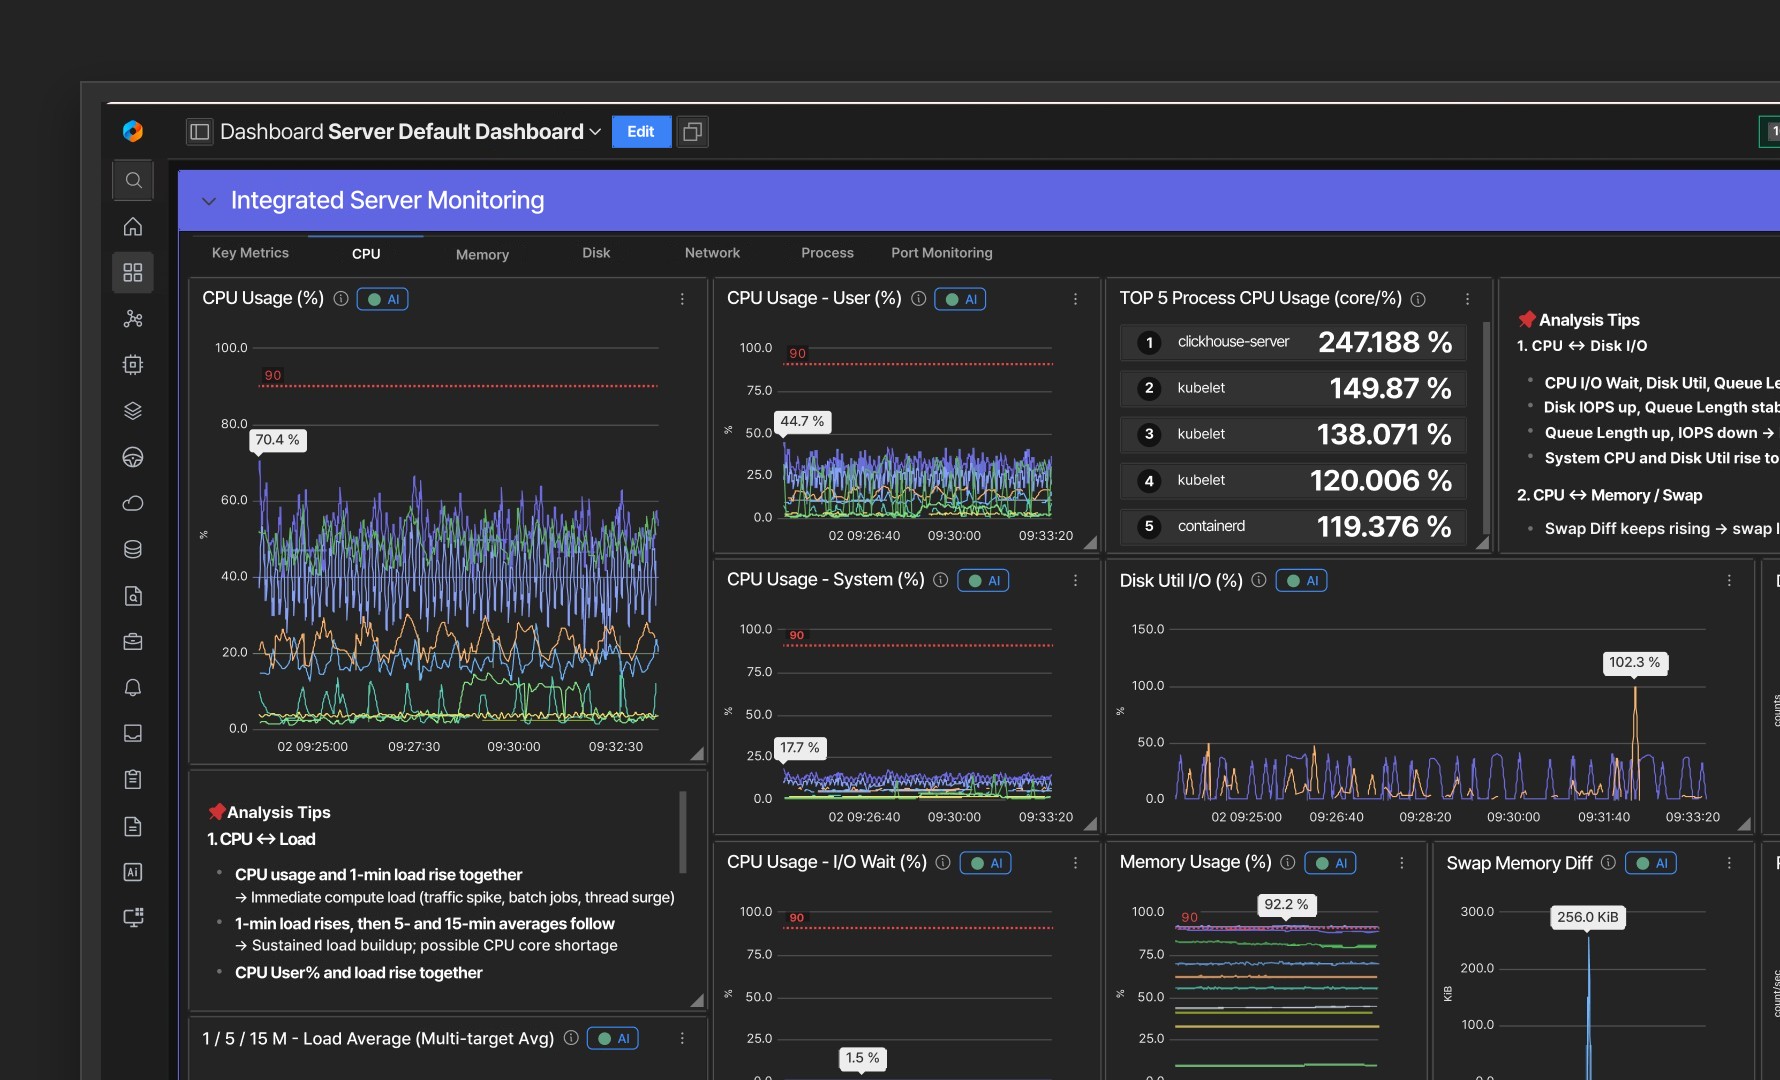
On-Premise and CloudIdentify Cause with
Correlated Data AnalysisCreate your own dashboard by packaging targets, key metrics, and charts. Customizable report formats and scheduling make collaboration easier.
Instantly load frequently used metrics without complex setup. Increase management efficiency with standardized dashboard configurations.
Integrate systems running in diverse environments into a single dashboard. Experience both flexible scalability and stable operations.
Drill down from the main view to intuitively explore correlations between metrics. Identify the root cause of problems with speed and accuracy.
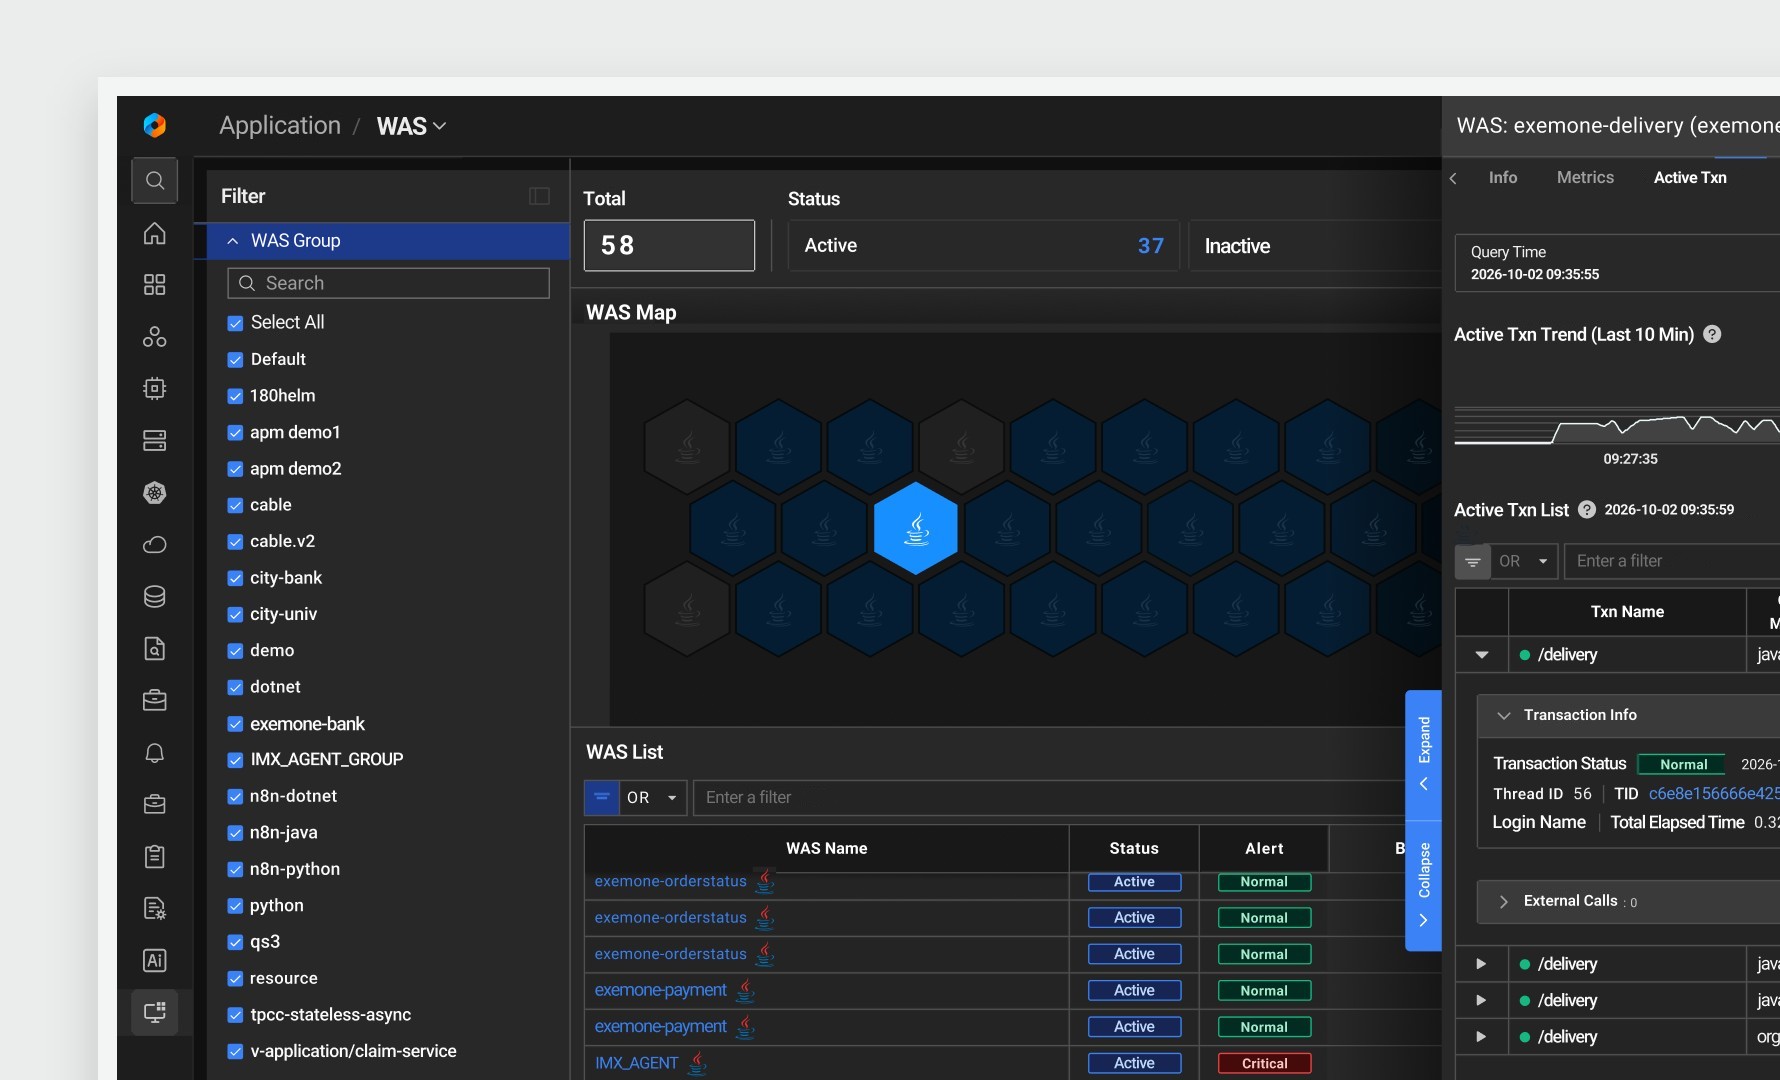
Multi-Data Analysis
From App Performance
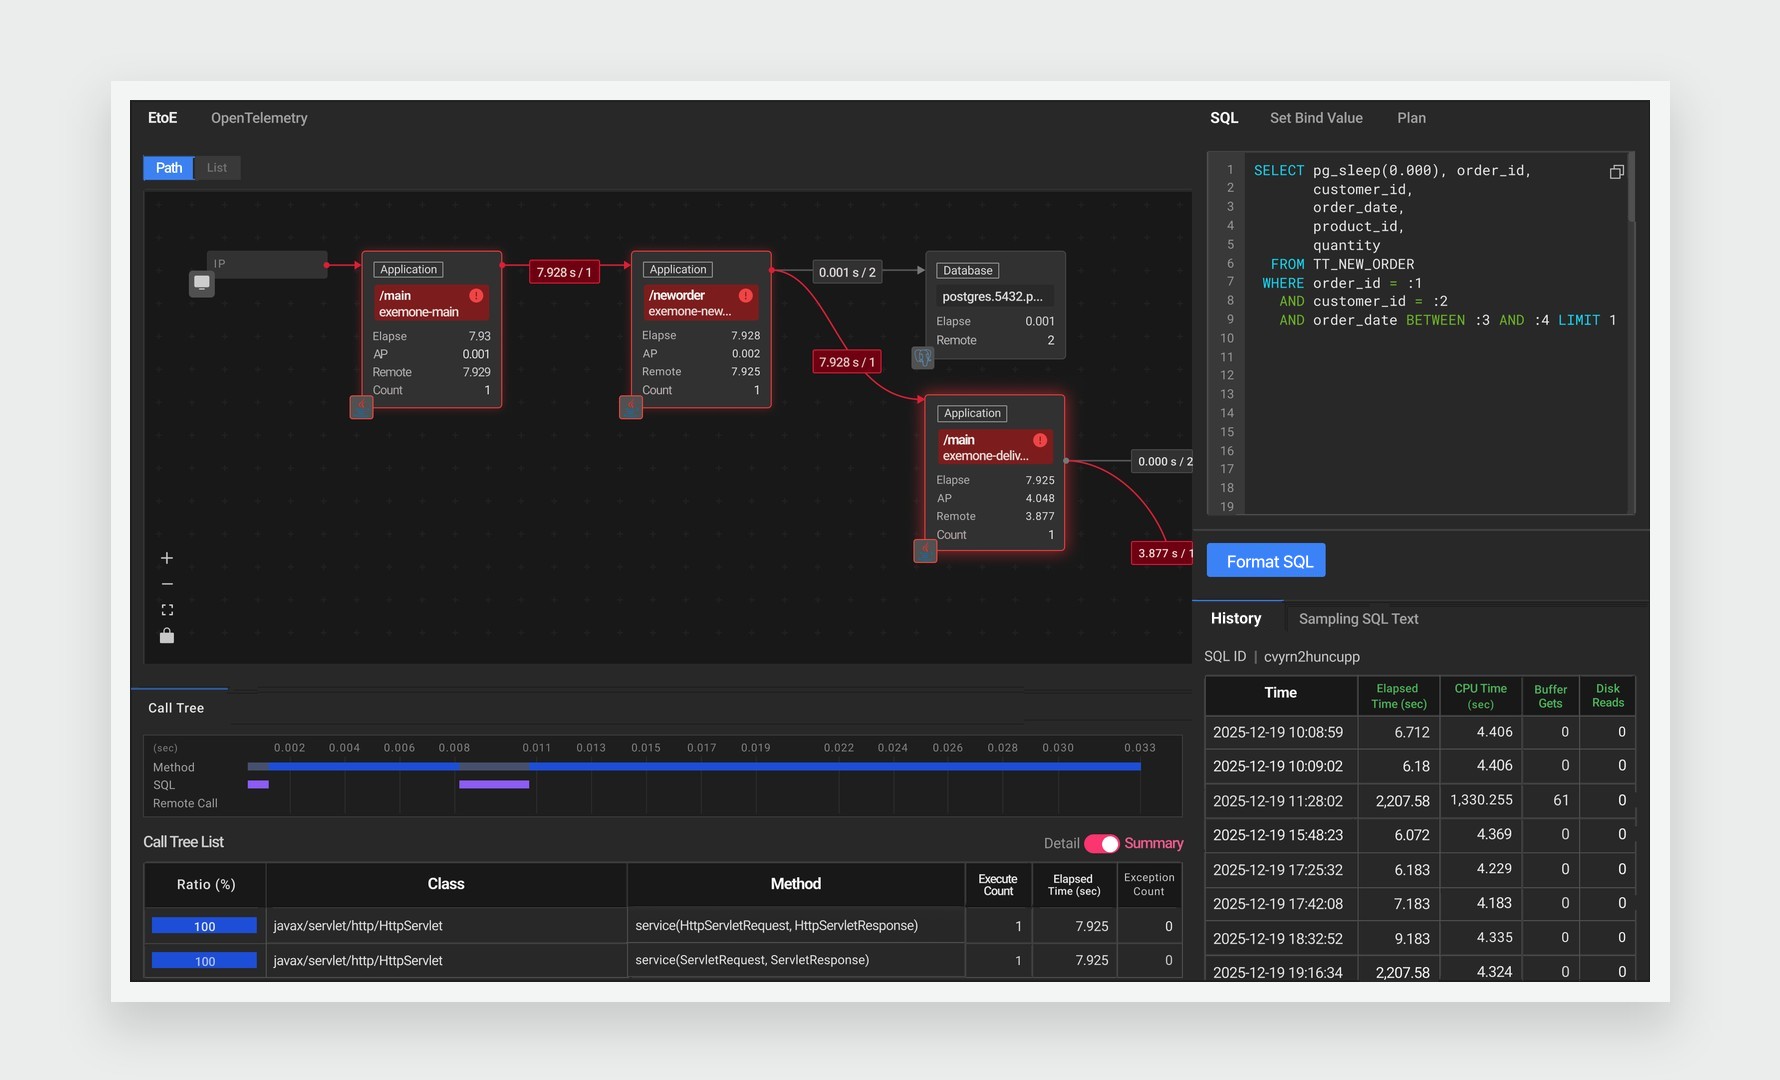
to Data TrendsManage system performance from every angle: transaction trends, top transactions, SQL performance, and bottleneck Call Trace analysis.
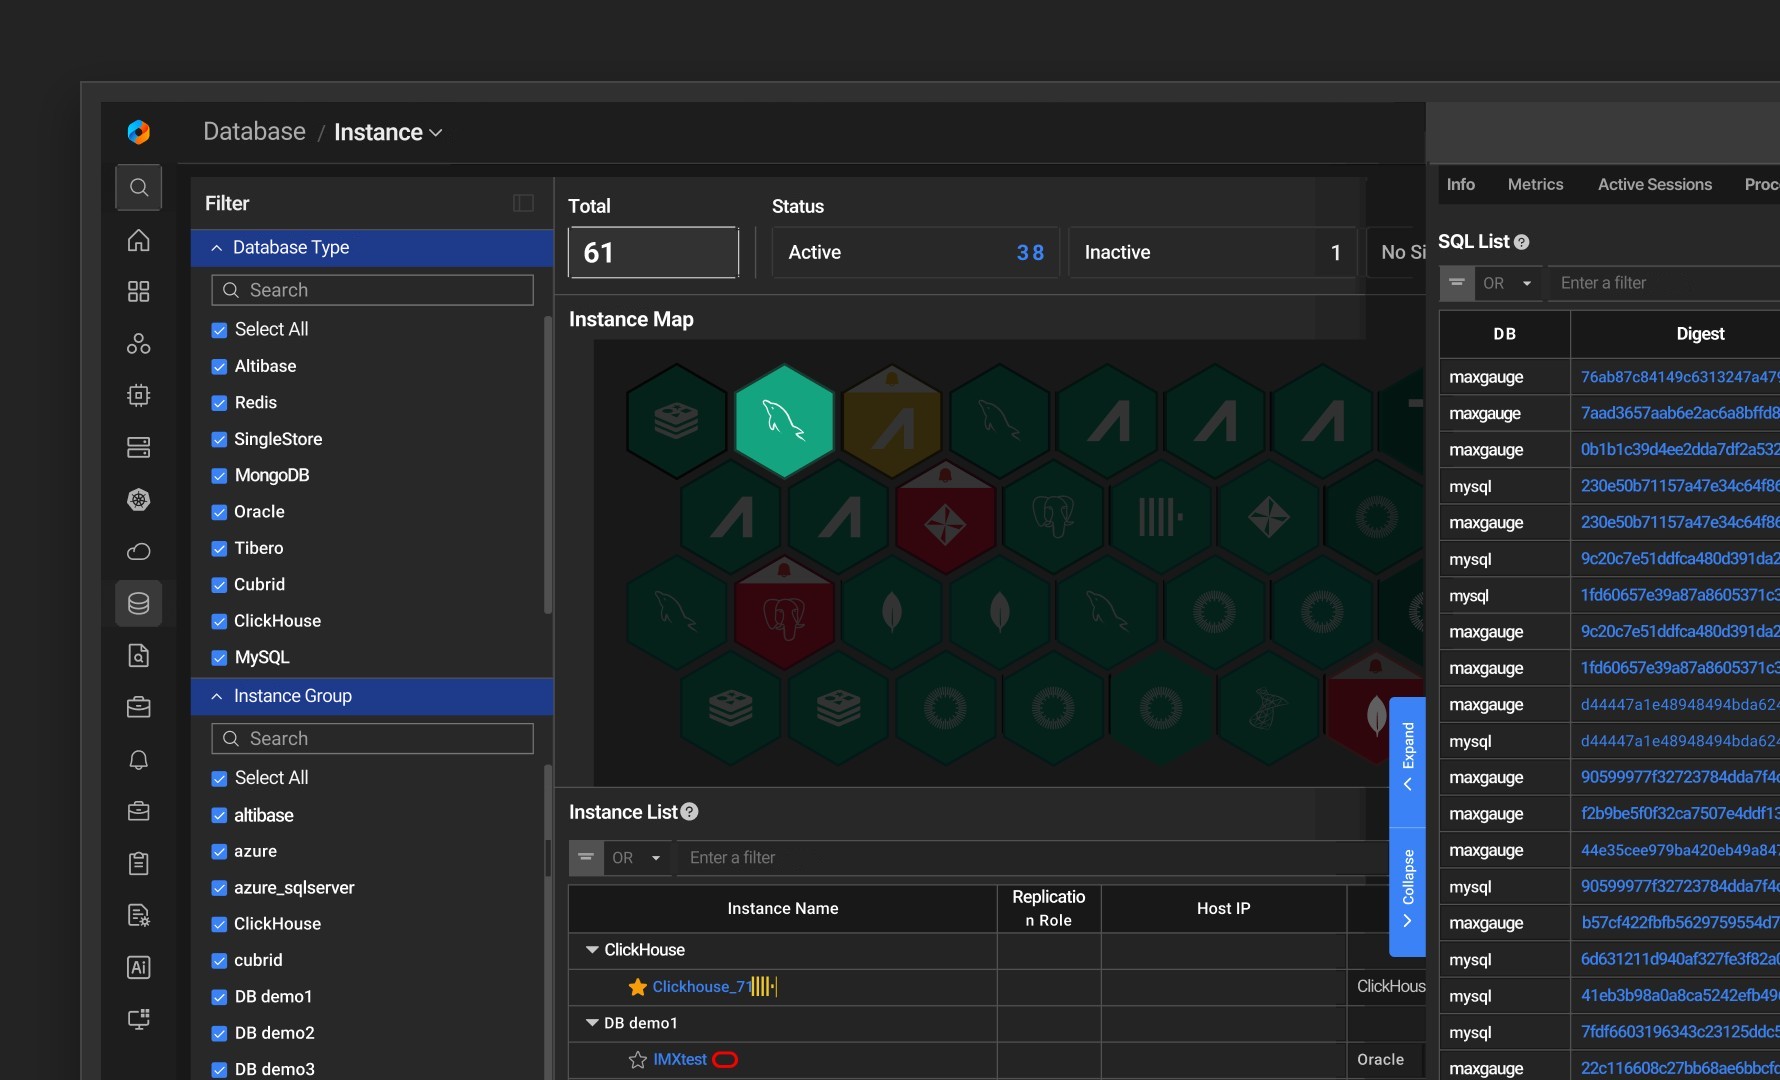
Service Operations Visibility
From Service Relationships
to Events at a GlanceNotifications that Know
What MattersIntuitive Monitoring
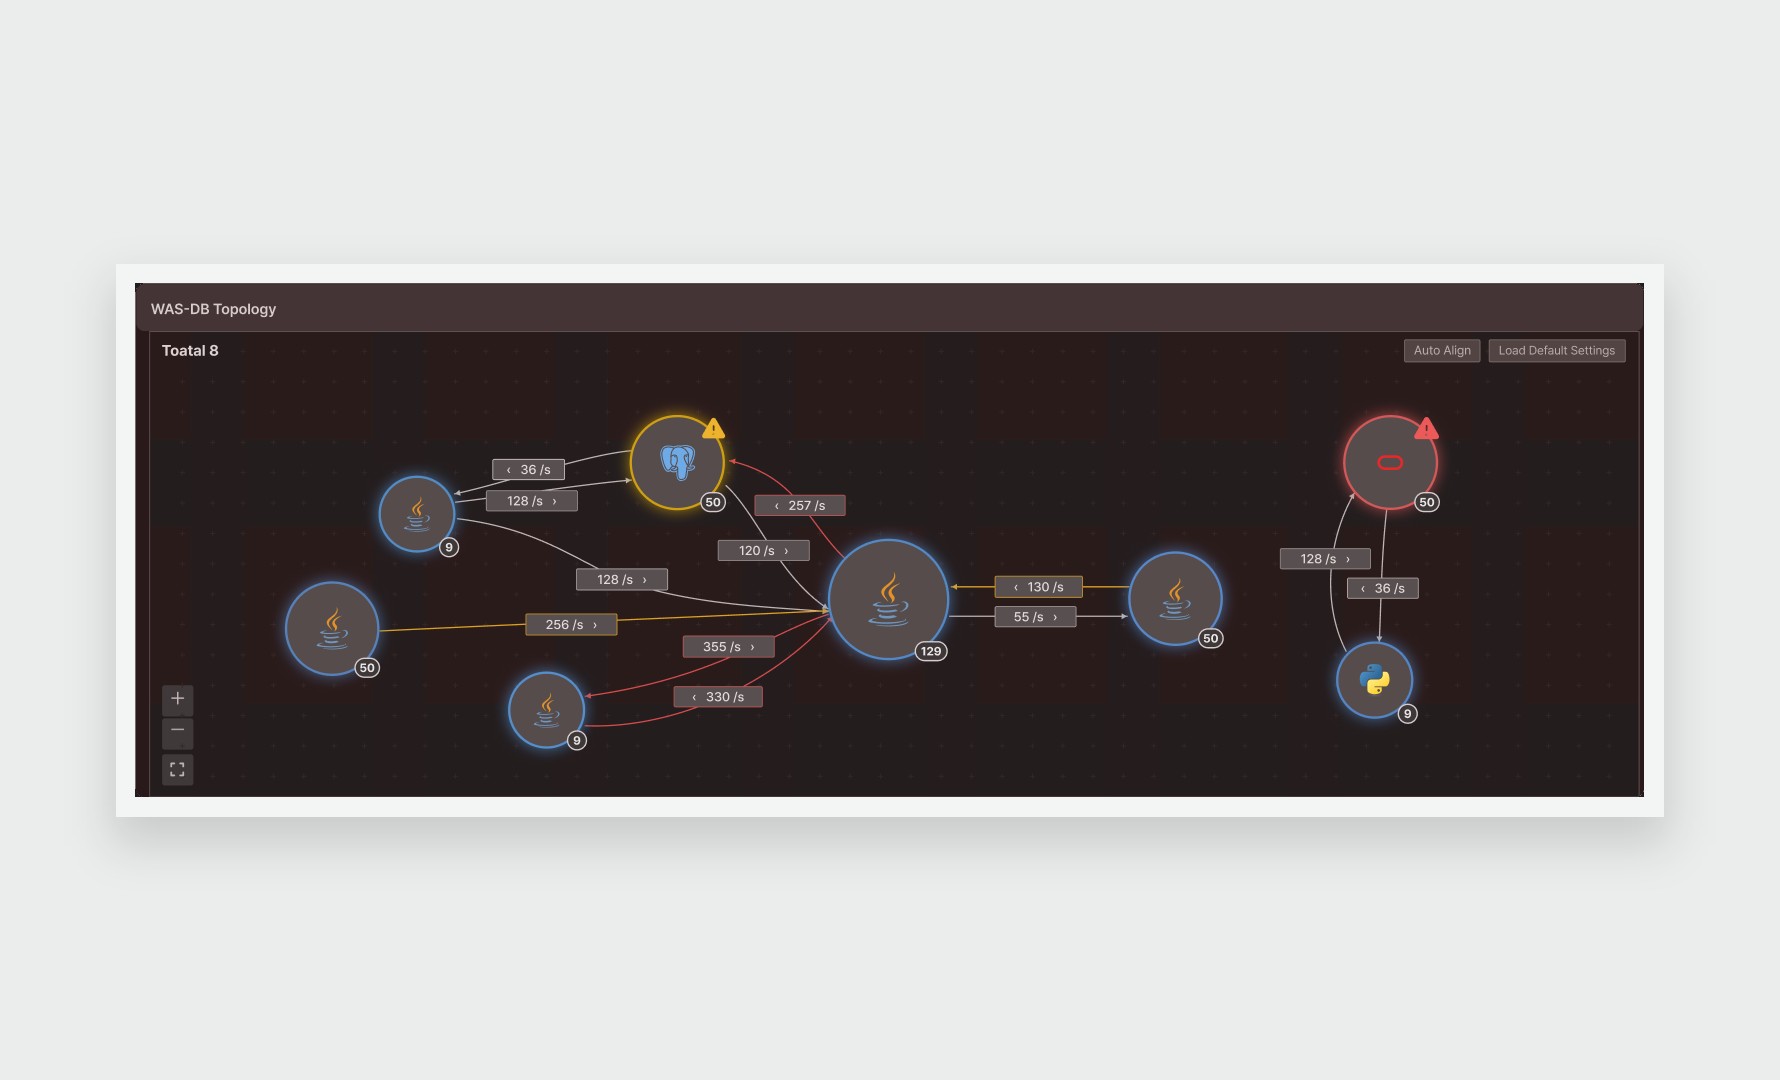
by Business UnitVisualize connections and status across service components, and review events and alerts together to intuitively understand operations and impact scope.
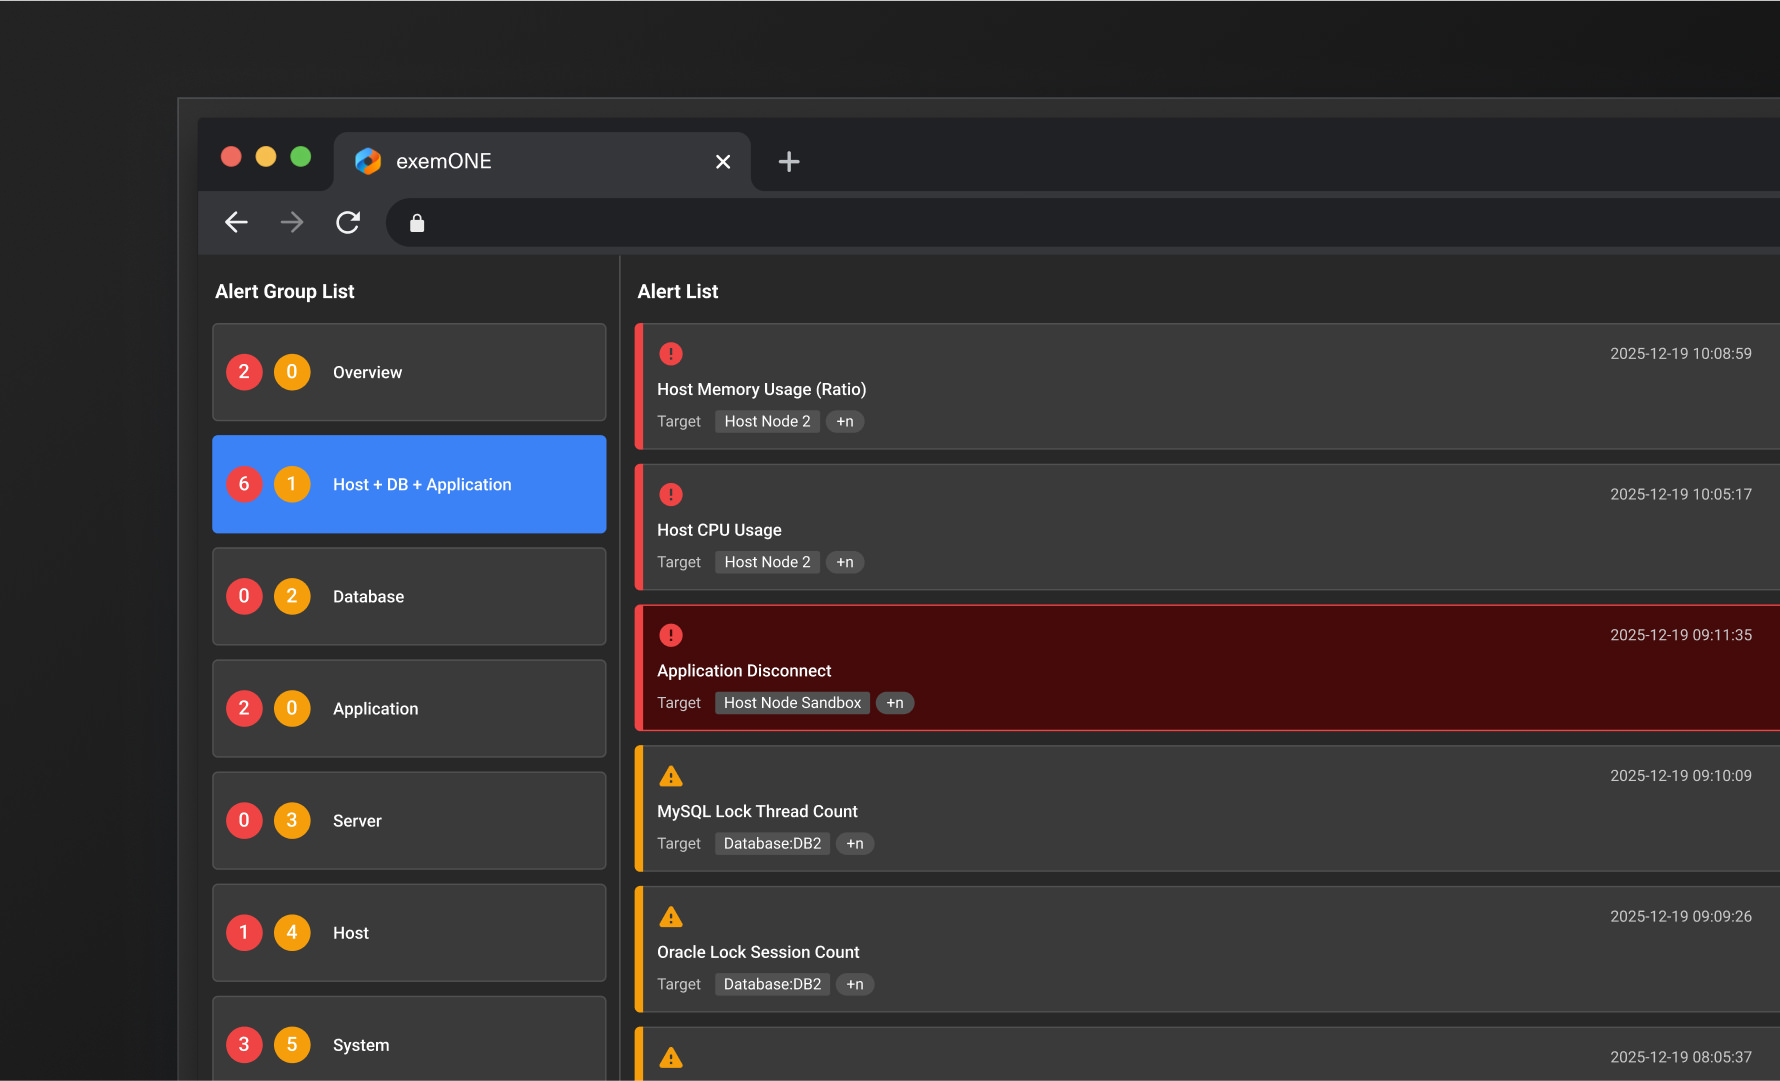
Manage every alert in one place and respond by filtering for specific targets or groups, enabling fast, efficient incident response.
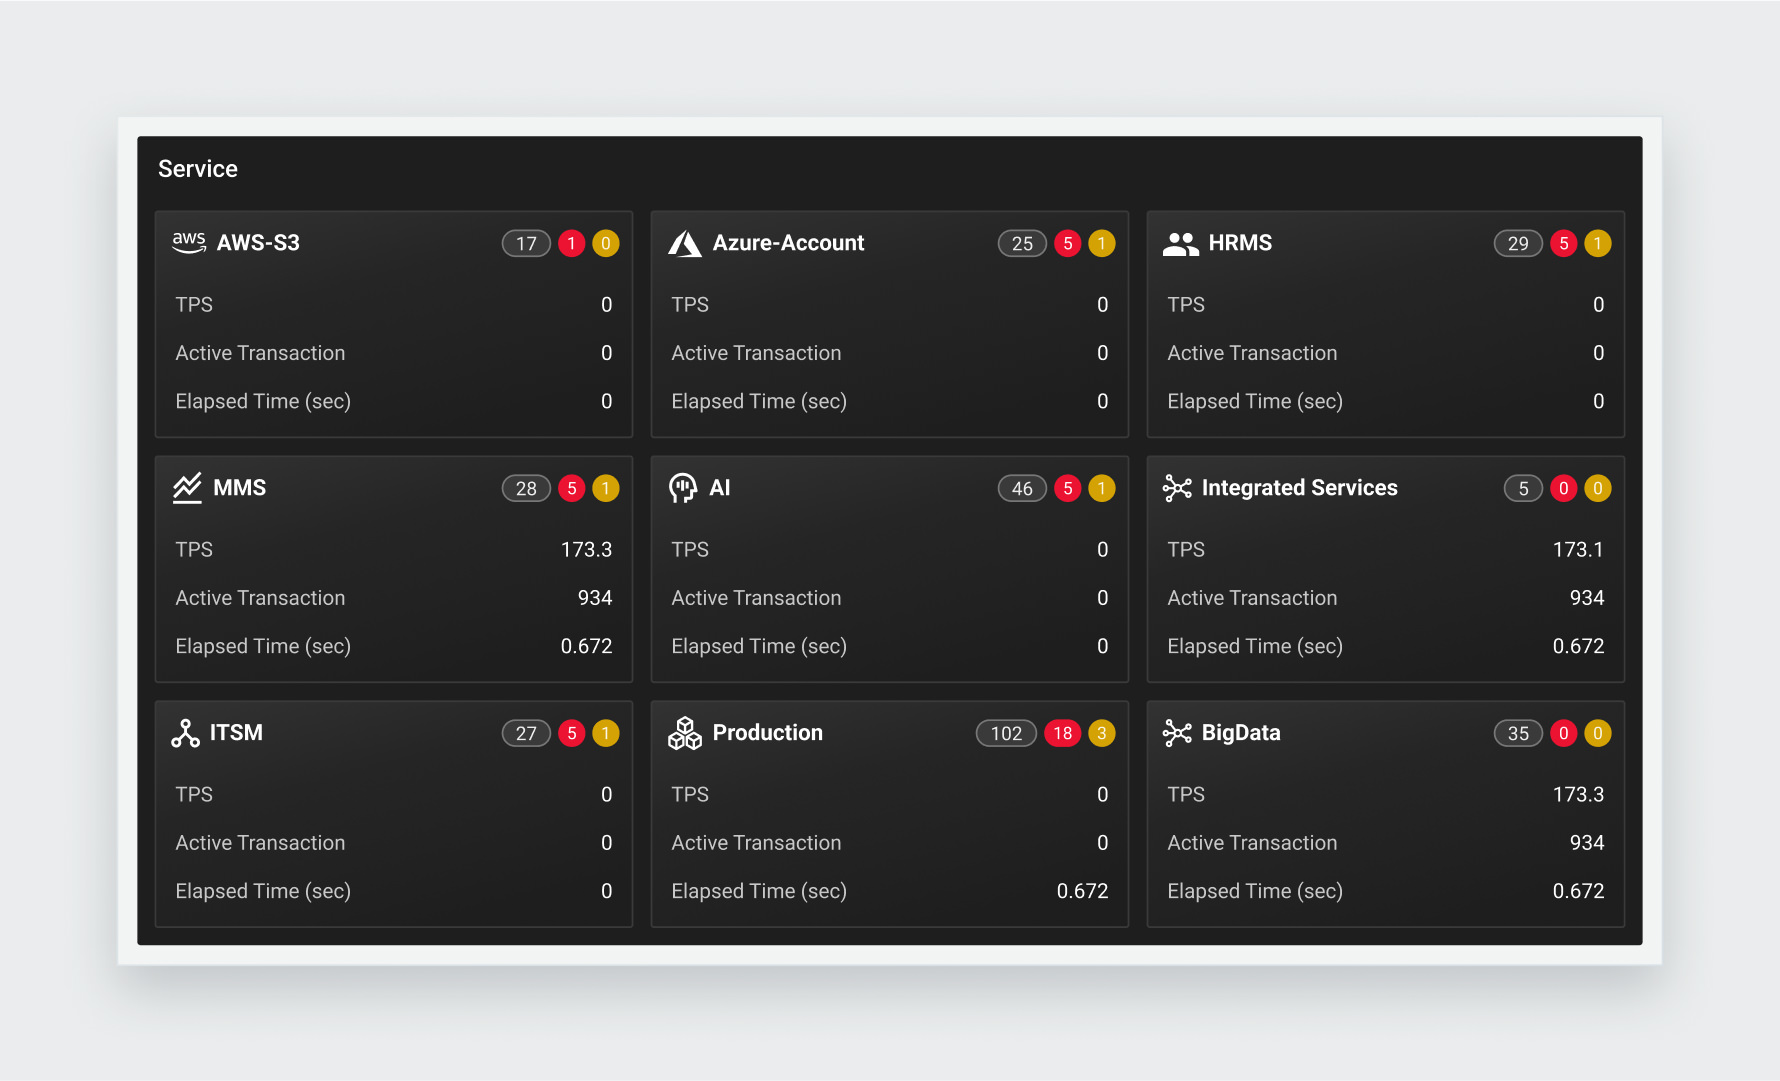
Group key metrics by service to intuitively grasp performance and status, with unified monitoring tied to business impact.
AI-driven Operational Intelligence
From Anomaly Detection
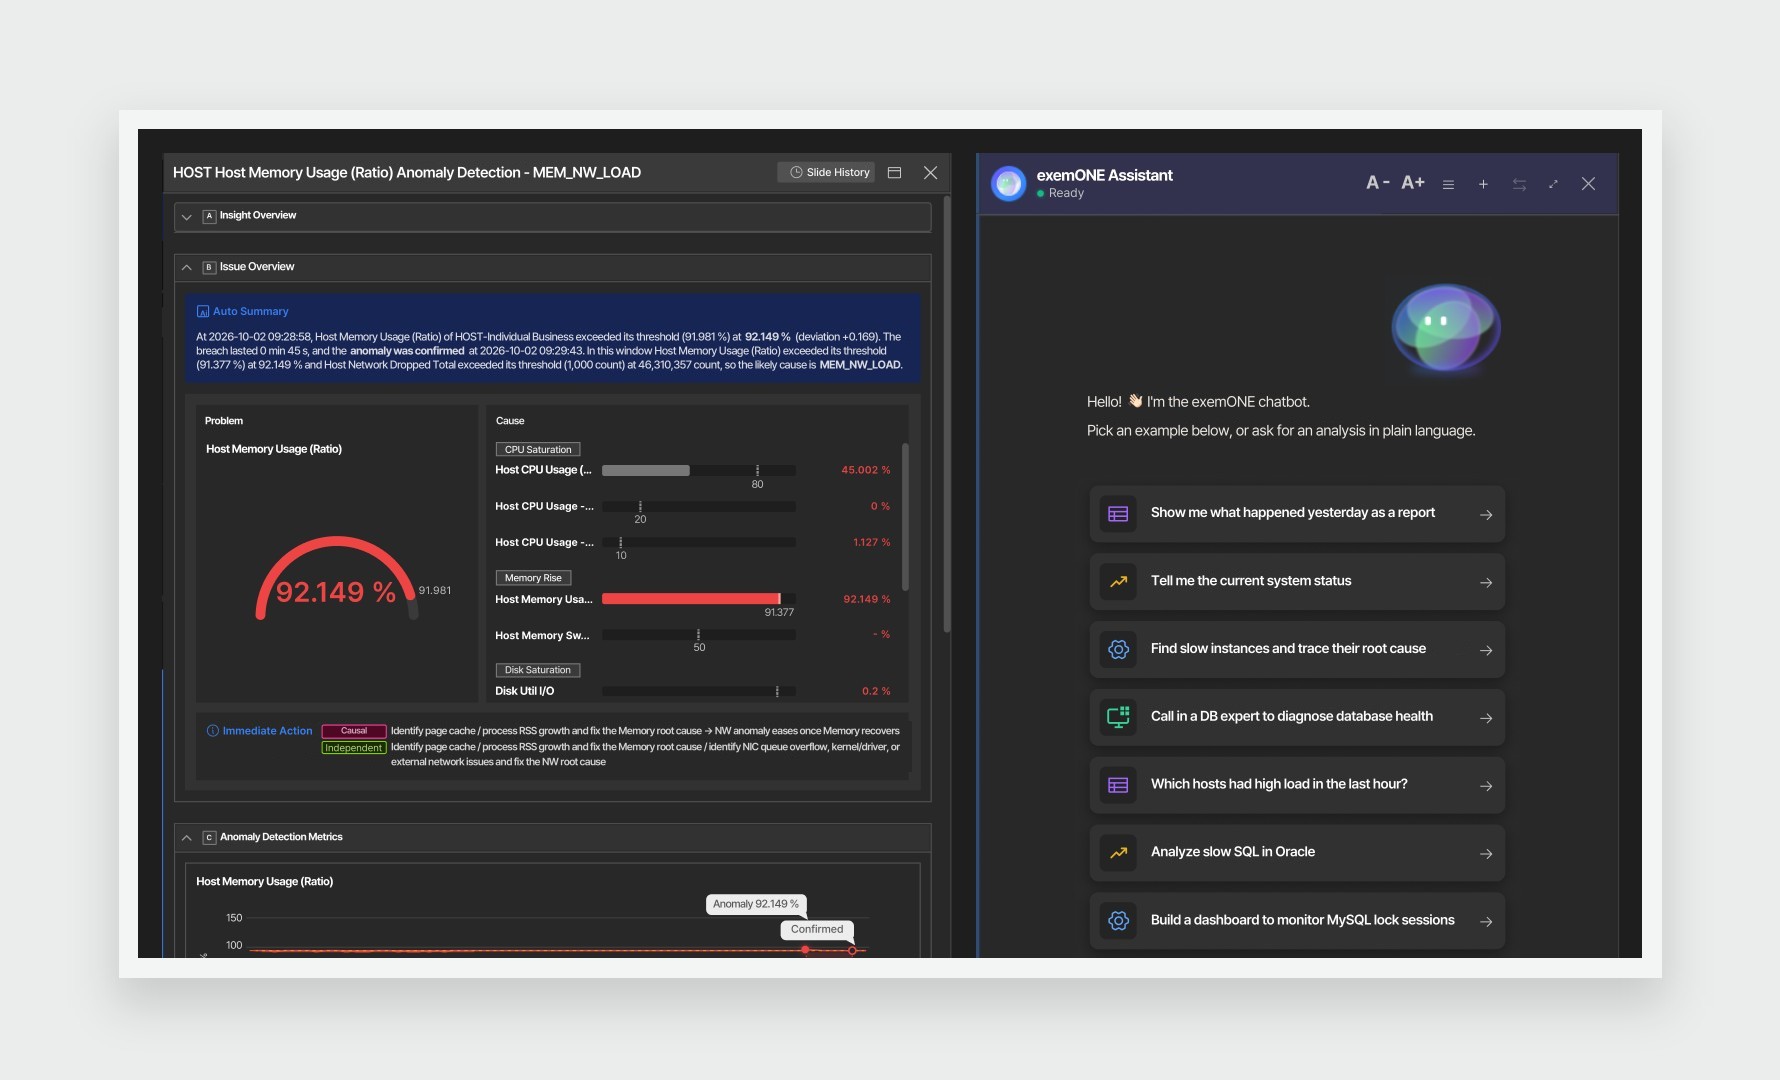
to Root Cause with AIAI detects anomalies in operational data and analyzes root causes. Use the chatbot to review incidents and analysis results intuitively.
GPU Monitoring
Scattered GPU Resources,
on a Single PlatformSee scattered GPU information on one screen. Monitor everything from GPU devices and MIG instances to the Kubernetes Pods using them.
EXEM Goes Beyond Advice
It's a Partnership for Change
1:1 Consulting
In-Depth Consulting
From solution adoption to operational optimization, we provide systematic support from the client's perspective.
Root Cause Diagnosis
We pinpoint issues accurately through staff interviews and analysis of the system environment and operational status.
Post-Consulting Support
Through regular visits and remote support, we help keep your IT systems stable and optimized long after the engagement.
Integrated Knowledge Portal
Discover technical documentation, operational tools, and educational materials, all in EXEM Portal.
Interested in exemONE?
- Download

Find out more in the brochure for detailed features and specs.
Enhance IT Operations
with EXEM
Transform operations and management into real business impact.